Articles & Papers

CEE Executive Mobility 2026: What’s Driving Movement Across the Region

Perspectives from 30 senior executives on relocation decisions and leadership mobility across CEE

Participant Profile

The participant group represents a diverse group of leaders:

  • Executives employed by organisations headquartered primarily in the United States, France, Hungary, Germany, and the Netherlands
    • US companies stand out with the highest representation at eight executives, followed by France with five and Hungary with four.
    • Germany and the Netherlands each account for four executives, and Italy two, while Denmark, the Czech Republic, Luxembourg, and Poland headquartered companies each have one representative.
  • 56% of respondents hold responsibility for a single market within CEE, while 44% oversee broader regional roles, including CEE or EMEA responsibilities
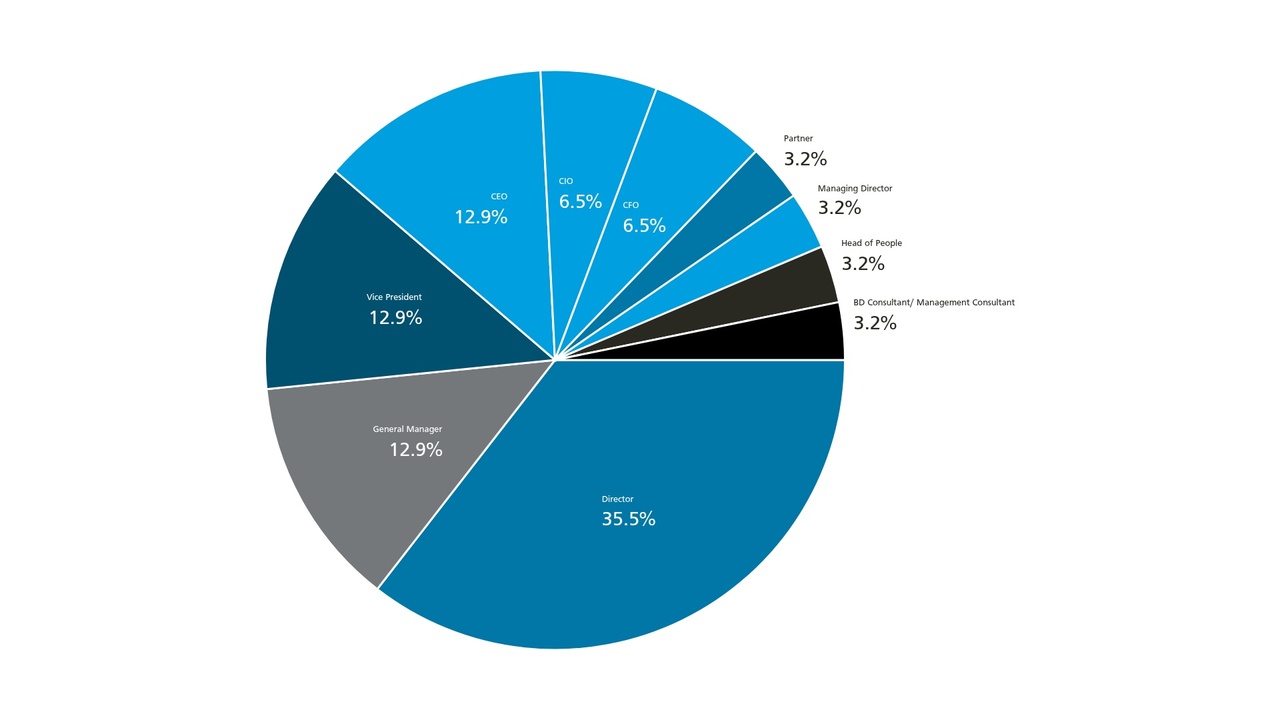
    • Overall, the data highlights a strong concentration of senior and mid‑senior leaders, providing a broad and well‑rounded view of executive mobility across organisational levels.


  • Participants represented a broad mix of industries, with Energy, Pharmaceuticals, and Consumer sectors accounting for more than half of the sample

  • The country-of-origin data shows a strong and well-balanced distribution, with Central and Eastern Europe accounting for the largest share of respondents at 63% (including participants from Poland, Romania, Russia, Slovakia, Hungary, and Bulgaria). The United Kingdom represents the next largest group at 13.3%, followed by Italy, France, Germany and Greece.

Most respondents brought more than 25 years of professional experience, and over three-quarters had relocated within the region during the past decade, with several having completed multiple international assignments.

Number of years of professional experience:

A pie chart titled “2.6 Number of years of professional experience,” based on 30 responses. The chart shows three segments: 73.3% in orange representing respondents with 25+ years of experience, 23.3% in red representing those with 16–25 years, and 3.3% in blue representing respondents with 10–15 years of professional experience. The legend on the right lists the three experience categories with corresponding colors.

Together, these perspectives provide a valuable view of executive mobility from leaders who have personally experienced relocation within Central and Eastern Europe in the past 10 years, more than 50% having relocated at least twice, some more than 4 times.


Have you relocated for work within the CEE or into the region in the past 10 years?

Overall, 24.1% of respondents reported that they had not relocated for work during this period, while 75.9% indicated that they had. This shows that a significant majority of respondents have undertaken at least one work-related relocation either within the CEE region or into the region during this timeframe.


How many relocations have you made in the region?

A pie chart titled “3.3 How many relocations have you made in the region?” based on 27 responses. The chart is divided into four segments: 48.1% in red representing respondents who have made one relocation, 25.9% in yellow representing those who have made two to three relocations, 14.8% in blue representing respondents who have made no relocations, and 11.1% in green representing respondents who have made four or more relocations. The legend on the right displays each category with its corresponding color.
This website uses cookies to ensure you get the best experience on our website. Learn more